As a result of the rapid acceleration of HR’s digital transformation due to Covid-19, talent acquisition leaders are now moving to embrace technology to gain insight into their business, and control over their processes.
To navigate the complex landscape of remote hiring, they’re adopting business intelligence tools that not only allow for robust data collection, but also enable them to easily interpret the data and gain insights to improve business decisions.
We believe that in the post-pandemic world, the ability to use and analyze recruitment data is critical, and a solid data infrastructure is a must for companies who are looking to improve the efficiency of their processes and optimize their talent acquisition efforts.
Before we dive into the business intelligence solution offered by Harver, let’s see what digitizing talent acquisition looks like in practice.
What’s in?
What it means to digitize your talent acquisition
If you look back a decade, investing in an ATS was considered “going digital”. Now, as new technology and best practices have emerged, a true digital recruiting strategy begins before the candidate has applied, and continues past hiring — including onboarding, performance, and business intelligence.
Digital now means integrating every piece of technology that measures talent acquisition KPIs, creating one seamless experience with the least amount of touchpoints, and a maximum level of agility and transparency for candidates, hiring managers, recruiters, and TA leaders.
So how do you navigate through this shift from traditional recruitment, to end-to-end digital transformation? There are key building blocks that add up to a digital recruitment strategy, that are being leveraged by companies around the world to ensure their processes are fast, fair, and data-driven.
Let’s dive into a brief overview of these building blocks, and how they impact the ability to collect and measure critical recruitment data.
Like what you see?
Don’t miss out. Subscribe to our quarterly digest to get the latest TA and TM resources delivered right to your inbox.
Matching technology
Matching technology is the cornerstone of your measurement efforts because it collects and analyses the raw data about your talent pool and new candidates.
Matching technology is a combination of pre-employment assessments that measure the skills and competencies of your applicants, to help predict who will be most likely to succeed in the role. Over time, you’ll be able to compare application data with performance data, to continually optimize your selection process.
Automation
The vast majority of recruiter or hiring manager work is made up of repetitive and laborious tasks, like CV screening, scheduling interviews, phone screens, and sending emails.
In tandem with your ATS, having matching technology in place allows you to automate repetitive steps of the hiring process, like skills assessments, interview scheduling, and candidate engagement. And, when processes are done automatically, data collection is constant and accurate — allowing you to generate insights into the efficiency of your processes.
Candidate experience
Inefficient, manual recruitment processes often result in frustration for recruiters and candidates, who are left waiting between the steps. Especially for entry-level roles, job-seekers are looking for job security and will drop out of the process if it is slow or unpleasant.
Adding matching technology and automation helps to reduce the “callback” period, so you can engage top talent quickly. In addition, by digitizing your recruitment process, you can also showcase your organization at scale with realistic job previews or company videos.
With these in place, your end-to-end digital recruitment process will be collecting a constant stream of actionable insights to give you control and the ability to optimize. If you’re not quite there yet and would like to learn more about how these pieces come together, have a look at this article, or request a demo below.
If you’d like to see how Haver can transform your hiring process,
book a demo here!
How the Harver business intelligence solution works
Once you have a digital process in place, you’re able to leverage an additional element of digital transformation: business intelligence.
Most recruitment tools have the ability to report on the data they generate. However, data is only valuable if it’s easy to analyze and interpret. For this reason, it’s critical to have real-time data on matching results, automated decision points, and candidate experience data, all in one place to break down the silos between phases of the hiring process.
To bring data from the entire hiring process together and create a command center for all things hiring, we’re offering an enterprise self-service analytics suite within Harver, called Insights, powered by Looker on Google Cloud.
Whether it’s sourcing data coming from job boards or social media job listings, assessment and interview data, or performance data, all the information is collected into a single source of truth, making it easy to see the full picture of your recruitment process and to spot inefficiencies.
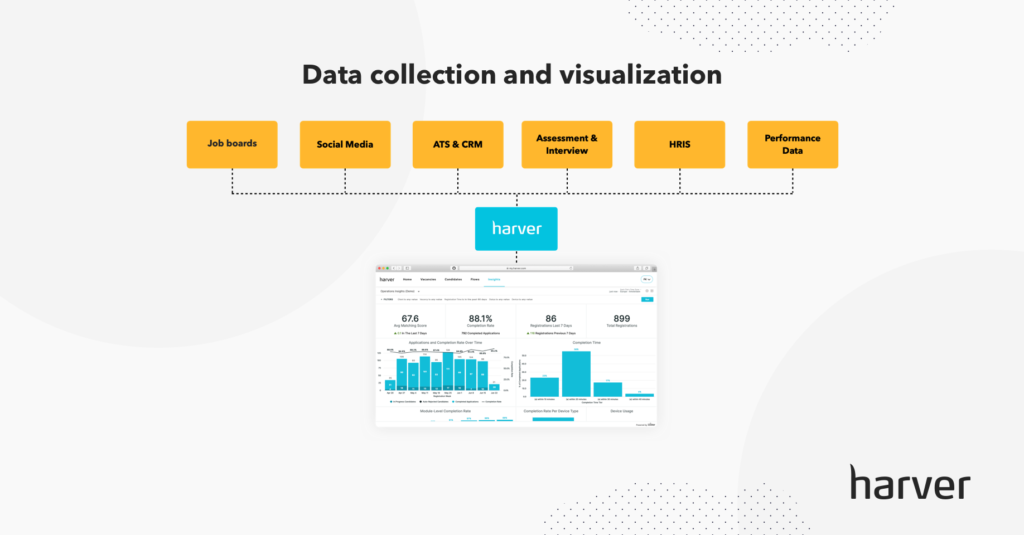
Harver’s candidate selection technology provides an abundance of data. To translate that data into actionable insights, we’ve curated a library of off-the-shelf dashboards that answer the most pressing topics in digital recruitment and selection, including 10 ready-to-go visualizations that are powered by over 100 individual data points.
Each dashboard is designed to tell the complete story of each candidate and to monitor the health of your recruitment process. Let’s dive into what this business intelligence solution looks like in action.
Recruitment dashboards library
Inside the Harver platform, recruiters can access a series of dashboards, such as:
- Operations Insights
- Matching Insights
- Candidate Experience Insights
- Sourcing Insights
- Time to Action Insights
- Hiring Insights
- Comparison Insights
- Bias Insights
- Personality Insights
The number and types of dashboards available for each client may vary depending on the specific implementation of the Harver solution. However, some dashboards, such as the Operations Insights below, are available to all users.
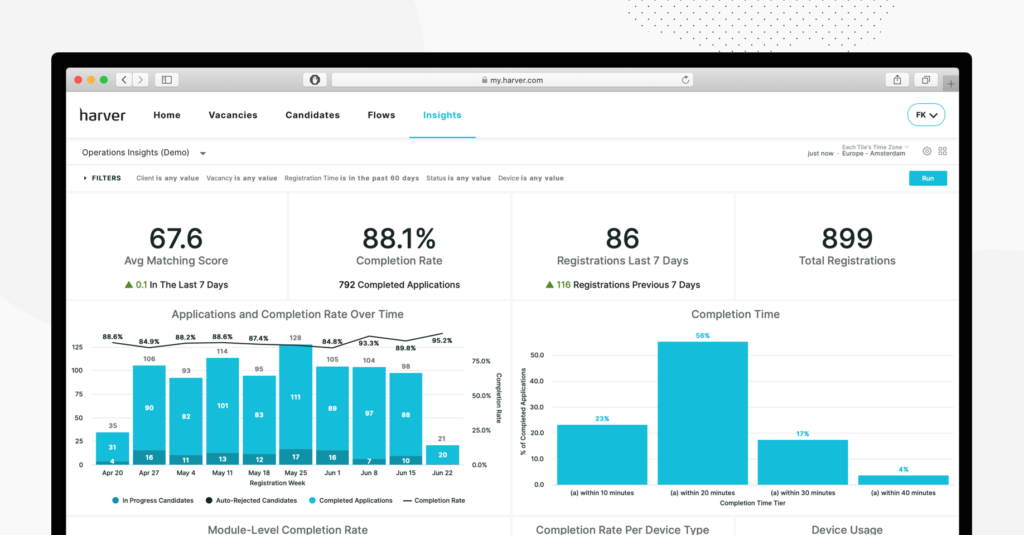
Each dashboard includes an extensive suite of configurable filters, so your team can slice and dice the data easily, to get the answers you’re looking for. The data is updated in real-time, giving you the ability to look at a snapshot of the present moment or track progress over time.
Each dashboard offers a unique view of your recruitment efforts. We won’t cover all the dashboards here, but we’ll take a closer look at the four most popular dashboards that measure the most critical elements of your digital recruitment strategy. If you’d like to see the full library, you can book a demo below.
Ready to transform your hiring process?
Sourcing insights dashboard
Trying to determine which recruitment sources are yielding the highest quality candidates is difficult even with high-quality data. The answer is critical to improving the quality of your talent pool and your new hires.
Traditionally, companies have focused their spend and outreach tactics on sources that have yielded the highest historical conversion rates, aka they put money where they can get the most applicants.
But, when you are looking for the best talent — not just any talent, the source that should be prioritized should be the one where you get the most new hires. Or, a step further, the step where you get the new hires who are more likely to stay with your company.
With a sourcing dashboard that looks not only at applicant volume and stage progression, but also new-hire and performance data, you’re able to identify where you get the most candidates from, as well as where your top-performing employees are most likely to come from.
This dashboard holds the answers to key questions, including:
- What is the breakdown of the candidate pool, by source?
- What are my conversion rates, and hiring rates by source?
- Which sourcing method provides the highest quality candidates, identified by their match score?
- The ability to A/B test candidate quality from sources, before making a large investment
- Are the best candidates applying at home, or through a QR code in stores?
- Do the best candidates apply on a laptop, or from a mobile device or tablet?
- Are candidates from a specific source more likely to drop out of the process?
If you’d like to see how Haver can transform your hiring process,
book a demo here!
Bias or D&I insights dashboard
The bias insights dashboard shows how inclusive your hiring processes are, and if any instances of systemic bias are appearing.
Inequalities in the hiring process are often the result of unconscious bias within the hiring funnel. For example, we know that an individual’s name on their resume can impact their chances of being selected for an interview in a traditional recruitment process.
In a digital hiring process, where candidates are assessed by technology, the dashboard helps to monitor bias in the steps that require human intervention. Not only can it identify potential bias in interview or phone screening, but also any adverse impact of your sourcing or selection.
Eliminating bias in the recruitment process is the responsibility of the entire organization, and all individuals involved in the recruitment process. But, the reality is that most firms are not equipped with controls to operationalize and monitor fair hiring processes at scale.
We developed the D&I insights dashboard so that organizations can identify bias at a high level, to leverage data to drive real change. In particular, we can identify if there’s an indication of potential name-based or gender-based hiring biases.
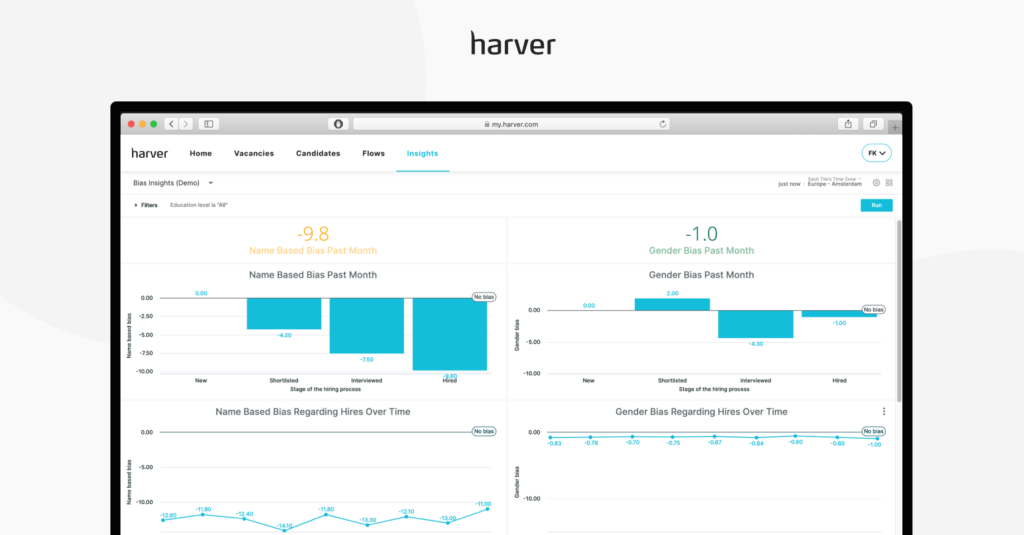
As you implement change within your organization, you can also monitor the impact of correction action over time. Most importantly, you can see if less qualified candidates are being selected at the interview or hiring stage over higher-performing candidates, based on EEOC data.
With Insights, we unlock the ability for organizations to use data to reflect on and operationalize their DEI efforts.
The state of diversity recruiting in 2020
Time to action insights dashboard
Time to action and time to hire are key metrics to track to know the health of your recruitment funnel. The best candidates are hired quickly, so your ability to move talent quickly through the recruitment process will directly impact the quality of your new hires.
You’ll also need to know how changes in the labor market, like fluctuations in applicant volume, are impacting your hiring. Is your funnel performance changing with volume as application volumes increase? Is your team slower to respond? Does hiring slow down?
Particularly when you’ve invested in end-to-end digital recruitment, your process should continue to move quickly no matter the applicant volume, with the goal of bringing in top talent as quickly as possible. Time to hire, time to invite to interview, time to reject, and how this varies from location to location will all impact your outcomes.
You can even drill down into the components of the hiring process at a step level to identify bottlenecks across different locations, or even specific steps of the hiring process.
The dashboard can also display both aggregate trends, trends by source, trends by location, and more to enable change where it’s most needed. As with all dashboards, the time to hire insights can act both as a snapshot of the current moment and allow you to identify trends over time.
Candidate experience insights dashboard
Candidates should be fans of your new digital process because it guarantees them a fair, fast, and engaging experience. Measuring the level of candidate satisfaction allows you to find any issues that arise, and also gives you the opportunity to keep tabs on the general sentiment of your talent pool.
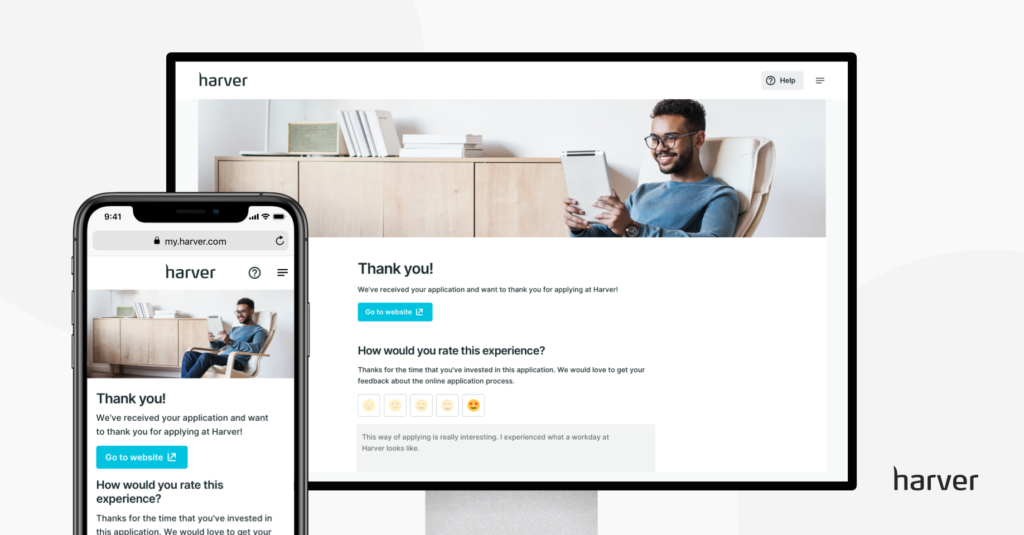
Digital doesn’t mean impersonal — candidates still want an informative and interesting application experience. And, they should have an opportunity to provide feedback early in the process. Otherwise, you’ll miss out on the feedback of any candidates who don’t get hired.
Businesses need an easy way to be proactive and keep tabs on what people have to say about the process with trending sentiments in real-time before you find that negative feedback posted on a social platform. Through the experience insights dashboard, you can keep a pulse on the candidate experience in real-time.
For example, you can see:
- Are your top-performing matches, the ones you want to attract, providing positive or negative feedback?
- Are top candidates completing the application in one sitting, and how long does it take them?
- Does the length of your digital process have an impact on the candidate’s experience with it?
- What are candidates saying right now? You can get down to the ground level, from real-time scrolling beads to sentiment-based word cloud analysis with drill-downs into actual commentary and, word by word sentences provided by people who are going through your process.
Next steps
In the last year, most businesses have pivoted to meet the new demands of hiring. While there may be a general sentiment of what worked and what didn’t, we see that many companies lack objective data to measure the outcomes of their recruitment program.
Although it feels like most change has been spurred within the last year, we know that this recruiting revolution is not simply a reaction to the public health crisis. Our world is constantly changing, technology is evolving, and businesses are moving towards agility and data to stay ahead.
By bringing together people science and data science, organizations can leverage actionable insights into candidate experience, sourcing, matching, and operations, to allow them to automate processes, save on costs and speed up their hiring process — all while finding the best possible talent to join their teams.
If you’d like to see how Harver can support you in gaining visibility into your recruitment metrics, you can book a demo below.
Ready to transform your hiring process?

