A little while ago we wrote about measuring the quality of hire (QoH). If you want to get the full picture of how you and your team are doing though, quality of hire should be connected with other key recruitment metrics.
Because linked together, they can give you valuable insights into every single part of your recruitment funnel.
There are a lot of different things to measure in the hiring cycle, but we’ve collected the 7 most insightful ones that every recruiter should track.
What’s in?
1. Sourcing stats
Let’s start with square one: sourcing. 21st-century recruitment gives us plenty of choices when it comes to sourcing channels. Job boards, employee referrals, social media, you name it.
Having sourcing options is great of course, but measuring their effectiveness as well is even better. Knowing which channel gives you the best candidates – who ideally turn into actual hires further down the line – can be extremely valuable.
If for example, your sourcing stats show you that most of your long-term employees came in via job board Y while the ones who leave the company prematurely generally came in via agency Z, you can modify your sourcing strategy accordingly.
How to measure you ask?
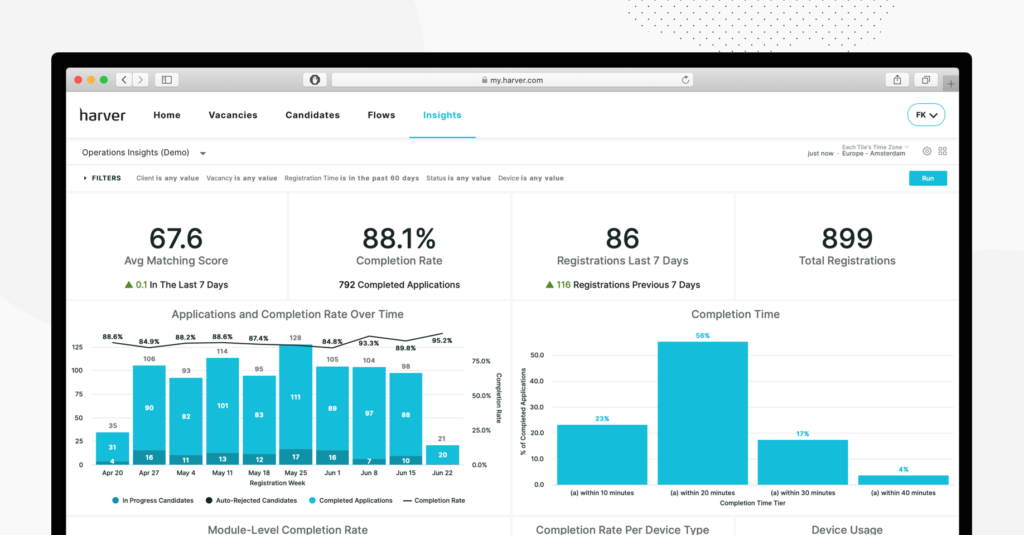
If you handle high volumes of applicants, you can use a recruitment platform like Harver, which gives you insights into your hiring metrics through a series of dashboards. Among others, you can see your sourcing metrics, so you can optimize your strategy based on the most effective sources.
2. Applicant drop off rates
How many of your applicants don’t make it to the end of the application process? And at what point do most of them drop off? Do most of them drop off via mobile or desktop?
If you monitor your application completion/drop off rates, this should help you answer these kinds of questions. The insights you gain from the collected data are useful when you start optimizing your application process.
Here’s an example. It turns out that of all the applicants who use the mobile version of your website to apply for a job, only 10% read the job description from top to bottom while on the desktop version this is 70%. In this case, you might consider rewriting your mobile job description.
Speaking of mobile, a well-oiled mobile careers page – and application process – really isn’t optional anymore.

90%
of job seekers use their smartphones to job hunt
Source: https://theundercoverrecruiter.com/
While Boomers, Gen X, and even some Millennials may eventually end up on the desktop version of your careers page, you won’t see Generation Z there. For those born between 1996 and 2012, it’s mobile-first.
Smartphones are their preferred mode of engagement, whether it is for entertainment, communication, or indeed recruitment. So if you want to stand a chance trying to hire these tech-savvy digital natives, a visually oriented, mobile-enabled recruitment and application process is your starting point.

3. Time to hire (TTH)
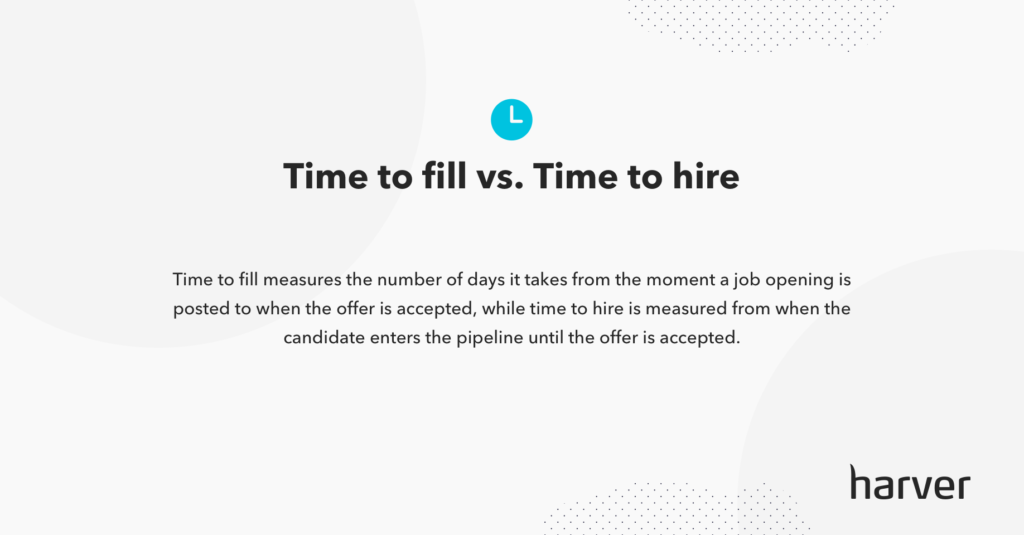
Time to hire shows you how much time it takes to get a certain position filled. The time span covers everything from the moment it becomes clear that there is a need for a new employee, until this employee’s very first day.

Time to hire also tells you something about the efficiency of your recruitment process. In order to optimize this process and be able to do succession planning, organizations should be aware of how long it takes to hire someone.
For more information on how a good understanding of this metric can help improve your recruitment process, check out this case study of supermarket chain Albert Heijn and how they shortened the hiring cycle by 60% while improving on quality as well.
And learn 15 ways to reduce your Time to Hire!
Learn the tactics top recruitment teams in your industry leverage to reduce Time to Hire. Stop losing candidates to competitors, improve your company’s bottom line revenue and candidate experience.
4. Quality of hire (QoH)
Quality of hire is also known as the Golden Metric. QoH is the number one recruiting metric for hiring managers in terms of importance. There are several reasons for this:
1) Quality of hire has a long-term impact on the business – the performance of your employees is directly linked to the success of your organization as a whole.
2) QoH improves the overall quality of staff. Quite literally it’s about improving your workforce one new hire at a time, which eventually will increase retention rates – more high-quality hires mean better fits, thus fewer premature departures.
An example of how tracking quality of hire has a positive effect on the overall quality of staff:
About 11 months after they’ve joined your company, it turns out that those employees who scored superbly on stress resistance during the pre-employment assessment, perform up to 93% better than those who didn’t.
With this insight, you can modify your preselection process and let stress resistance weigh heavier. As a result, both the individual and overall QoH of your workforce will increase.
This example shows how picking out one element – stress resistance – can lead to a better quality of hire. Imagine the results if you keep selecting one element after the other, hence continuously optimizing the preselection process and thus the (overall) QoH.
5. Cost per hire
Do you know how many resources it takes for successful candidates to go through your recruitment funnel? Think of advertising costs, recruiter fees, LinkedIn and other social media accounts and job fairs for example.
The cost per hire recruitment metric shows companies how much it costs them to hire new staff.
This includes both individual hires as well as the total number of new employees. Just like time to hire, the cost per hire metric also gives you an insight into the (in) efficiency of your recruitment process.
Tip: Just like your sourcing stats, keep the costs information together in one place, easily accessible for those involved. You may even want to have the sourcing (performance) data and costs per sourcing channel in the same overview, whatever works best for your organization.
As long as you keep track of the costs per channel; recruiter fees, social media accounts, job fairs, everything.
Like what you see?
Don’t miss out. Subscribe to our quarterly digest to get the latest TA and TM resources delivered right to your inbox.
6. Offer acceptance/rejection rates
So your applicants make it all the way to the end of your recruitment funnel, well done. But if they don’t accept your job offer afterward, that doesn’t mean a lot.
The offer acceptance rate metric shows you the percentage of candidates who accepted your formal job offer. A low acceptance rate indicates that there’s something off in your talent acquisition funnel.
A few examples of what could be the issue here. It’s possible that candidates simply weren’t happy with the proposed salary and/or company benefits. Or that they didn’t like your company culture. Perhaps they got a better offer somewhere else. And sometimes candidates just want to use an offer to get a pay raise from their current employer.
If you know why your offer got rejected and the reason is within your control – like when your salary isn’t in line with the competition for instance – you can do something about it.
Tip: If the number one reason applicants reject your offers is the salary and you can’t compete financially, try to think of something else you can offer them. Extra holidays? Free lunch on Fridays? A work from home option?
The good thing about millennials and generation Z workers is that the salary isn’t the most important thing for them. So get creative and seduce them with perks other than money!
7. Early turnover
We’ve said it before, recruiters and hiring managers really only want to know one thing: is our recruitment process selecting the right people or not?
Another very important recruitment metric to look at for the answer to this question is your early turnover rate; the percentage of people that left the company voluntarily within a year after they started.
A high early turnover tells you there’s either a mismatch between the candidates and your company culture or between the candidates and their (expectations of the) job.
Also, a lot of early turnover is due to a non-existent or bad onboarding process. Why put in all that effort to recruit someone if it’s only to see them resign a couple of weeks later?
If you don’t have the time to make sure your new hires get to know their colleagues and the company then look into an onboarding app to help you out. There’s some great software available that can pretty much take care of all things onboarding for you; from introducing the new recruits to their co-workers to making them familiar with the organization’s systems and more.
Stop guessing, start measuring
One of the biggest advantages of using that same HR technology is that you can track and analyze performance. It turns the recruitment funnel into a big machine with lots of different knobs you can turn.
And the best thing about all that measuring? It gives you insights you can use to improve things! And that means you can make work life a lot more pleasant for everyone; individual employees, teams, managers, and yes, yourself too.
Measuring the 7 key recruitment metrics described in this post, for example, provides us with valuable information into – among other things – our recruitment process. It shows us what works and what doesn’t.
As such, these insights form the first step in optimizing the recruitment funnel, one metric at a time.
Ready to transform your hiring process?


