When hiring at scale, data is your biggest asset. However, in a lot of companies that do volume hiring, recruitment data is gathered separately, in different HR systems. This leads to siloed data collection and leaves talent acquisition teams with numbers that are hard to interpret and act upon.
As a result, despite collecting massive amounts of data, TA teams aren’t able to extract useful insights from it, without manual processing.
While it might seem like a case of “if it ain’t broke, don’t fix it”, that simply isn’t true. If your company does volume hiring, you need a better way to collect, analyze and interpret your recruitment data, so that every member of your organization not only has access to it but easily understands it.
And there is a better way to do this – it starts with clarifying what recruitment data you need to collect, from which systems, and why.
What’s in?
Like what you see?
Don’t miss out. Subscribe to our quarterly digest to get the latest TA and TM resources delivered right to your inbox.
1. Job boards
If you’ve posted a job opening on a job board, it isn’t simply a case of wait and see who applies. By tracking and analyzing data and key metrics, you can make powerful decisions that will enhance your advert and ultimately improve the quality of applicants and the quality of hire.
By tracking certain metrics from your job board, you get a better understanding of how your ads are performing. You can discover where visitors to the job board have come from, their demographics, their locations, even the devices they’ve used to view your job ad, allowing you to funnel budget into improving the more successful marketing channels.
At the same time, collecting this data can show you which adverts aren’t working, and which are the most popular – so you can optimize the lower performing ones.
As well as tracking the performance of your ads, other job board metrics worth tracking include: how many people have seen your job, how many applications have been submitted, the number of applicants, and the cost per applicant.
Why do these numbers matter? Because when you’re spending money advertising your open roles, you want to make sure you’re investing in the sources that yield the highest quality applicants.
2. Social media
Around 94% of recruiters use social media for sourcing candidates, and for good reason. With the majority of the workforce made up of Millennials and Gen Z, targeting these cohorts via social media is one of the easiest ways to connect with both active and passive candidates.
By tracking key social media metrics you can find out if your recruitment strategy is working for you. Move beyond vanity data metrics such as how many likes your posts are getting, toward more actionable business insights that you can use to tweak and improve your campaign.
Essential data you should be tracking includes which social media platform yields the best results, and how many candidates each platform is generating. Capture cost per hire data – there’s no point wasting valuable budget on marketing campaigns on Twitter, if the majority of your target audience is on LinkedIn.
You also want to measure your demographic data – you might have high engagement with your recruitment posts, but if you’re targeting graduates or entry-level applicants, and your posts are only getting clicked on by retirees, it won’t help your campaign.
Similarly, track return on time. Just because marketing on social media is free, you’re still spending time on the social networks, and you don’t want to waste your time. By tracking data all the way from the initial click on your link through to a conversion, you can measure your ROI and direct more resources towards the best-performing campaigns.
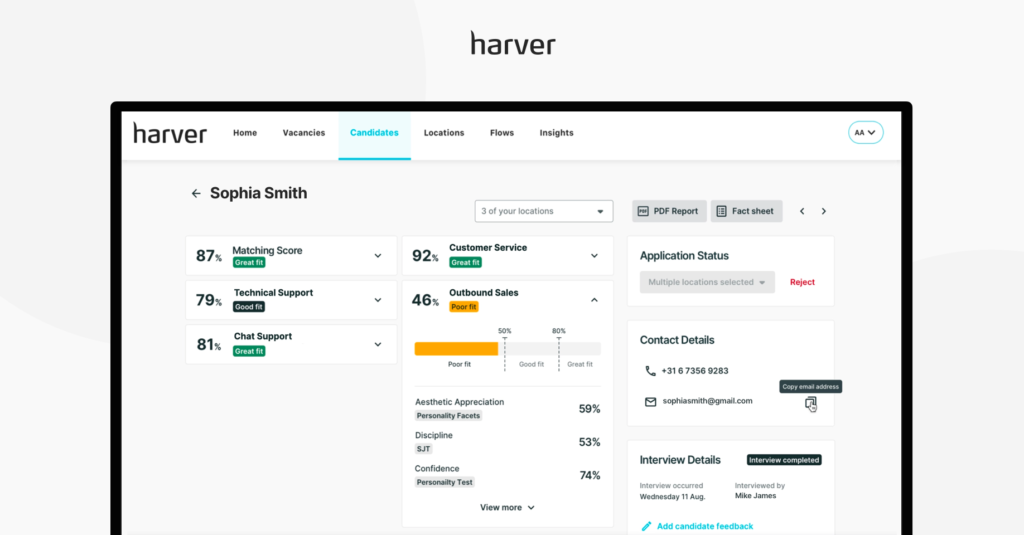
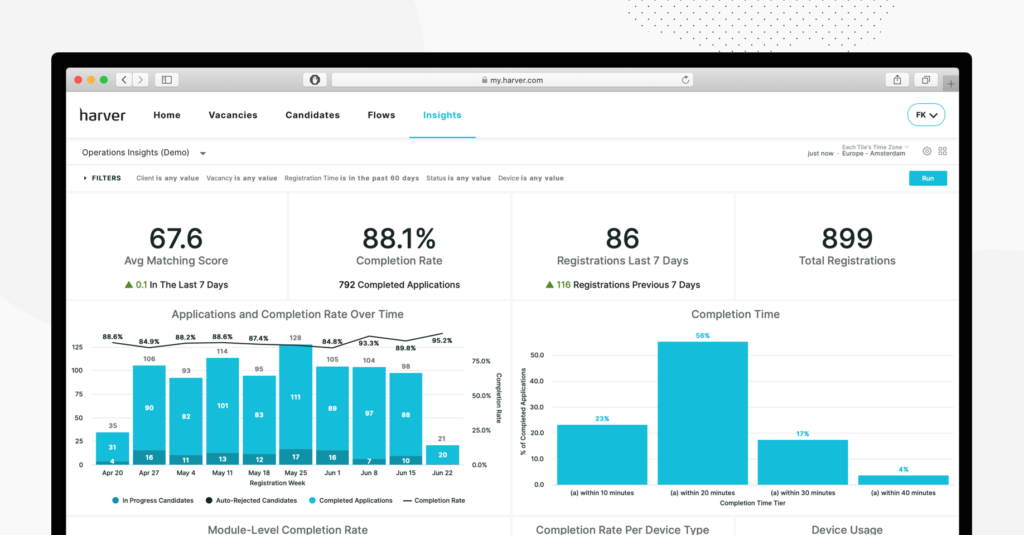
Note: Harver enables employers in the volume hiring space to collect all their recruitment data, from sourcing to performance data, in one platform. The BI suite, Harver Insights, connects all the data sources and acts as a single source of truth, offering talent acquisition teams real-time insights into core recruitment KPIs.
Harver provides a series of out-of-the-box recruitment dashboards for easy data visualization, such as Operations insights, Time to action insights, Hiring insights, Matching insights, Bias insights, and so on. If you’d like to take a closer look at Harver Insights, you can book a demo below.
Ready to transform your hiring process?
3. ATS & CRM
Your ATS is the backbone of your recruitment strategy. It’s the software that streamlines your recruitment process, collecting data and tracking applicants, measuring your sourcing and recruiting efforts.
If you want to know where each candidate came from, which role they applied to, where they are in your application process, your ATS should be able to give you the answers. If your ATS is smart, it should be able to tell you which candidates you have in your talent pipeline match your open roles.
When you’re carrying out high volume hiring you also want it to include candidate relationship management (CRM) tools to enhance the relationship you have with prospective candidates. But what data specifically do you want it to track?
Anything to do with candidates in your pipeline essentially. You want to process applicants quickly and efficiently while delivering a knockout candidate experience at the same time, and you can only do that if your hiring process is data-led.
From how many applicants are in your pipeline, to which sources they came from, how long they’re spending at each stage, time to hire, cost per hire, time to commitment, quality of hire, candidate drop out rate etc. You can also track basics such as how your application forms are performing, i.e. how many people started filling out your job application but abandoned it without finishing or submitting it.
4. Assessments and interviews
Pre-employment assessments yield a wealth of data. They come in all manner of shapes and sizes, and they can be placed at any stage of the recruitment process, from the first step to the last. Typically, they’re used to ensure that the candidates you hire are the best ones for the job.
Harver, for example, has a number of different pre-employment assessments, all of which are designed to help you test and measure academic skills, hard and soft skills, or job fit, for each candidate, so you can compare them against your benchmark predetermined criteria of what a top employee looks like.
Assessments help you track the number of qualified candidates who apply for your open roles: the more qualified candidates you have, the better you are at reaching your target audience with your marketing. Whereas if the assessments reveal a high number of unsuitable candidates, your recruitment process needs tweaking.
Assessment data can also help you with candidate routing. Just because someone isn’t qualified for your open role, doesn’t mean they aren’t suitable for a different role somewhere else in your organization, at a different location even.
While interviews are one of the few stages in your recruitment process that require a human touch, they still yield data that you can track – from how long it takes to get successful applicants to interview, to how effective your interviewers are, or whether you’re interviewing all applicants in a consistent way.

5. HRIS – human resource information system
Measuring HR efforts is critical to keeping an eye on the health of an organization. One way to track it is through HRIS – the integration of all HR activities and information technology – from data entry to data tracking. Most HR teams use it to help them improve their processes and to stay organized.
HR metrics are how your organization tracks its human capital and measures how effective its processes are. It tracks data such as employee turnover, employee attrition rates, cost per hire, or benefit participation rates, in order to help organizations improve their people strategy.
6. Performance data
Recruitment data doesn’t stop when you onboard employees. You should be tracking employee performance data too, to ensure your recruitment process is yielding quality employees.
Employee performance is a measure of how well employees are doing their job and is usually tracked by first establishing performance standards against which employees can be compared. These standards usually define what it means to meet or exceed your organization’s performance expectations.
Saying that, metrics vary per role; For example in a contact center performance can be measured by abandonment rate, first call resolution rate, the average time in queue, customer satisfaction score, and so on. While in retail, some performance metrics could be average items per sales, customer service, or product knowledge.
Data analysis and visualization through BI tools
It’s not enough to just collect data from multiple different sources. If you want to act on it and get better business insights instead of just numbers, you need a solution for integrating all these separate data points, processing them, analyzing them, and then visualizing the results in a manner that’s useful for your TA team.
A recruitment BI solution like the one offered by Harver is ideal, because it gives everyone the same big picture of your recruitment efforts, offering both out-of-the-box and custom recruitment dashboards.

Our dashboards include an extensive suite of filters that can be configurable to your precise needs, allowing your team to slice and dice the data as necessary, to get the answers you need. Plus, different data sources can be integrated, if you want to track more data.
Next steps
In volume hiring, capturing all your recruitment data in a single source of truth and turning that data into actionable insights with the help of BI tools is a crucial step in getting the big picture of your recruitment efforts.
If you’d like to see how Harver can support you in gaining visibility into your recruitment metrics, you can book a demo below.
Ready to transform your hiring process?


