Diversity, equity, and inclusion (DEI) is a hot topic in the workplace today, with an increasing number of employers actively working to incite meaningful change.
However, although DEI is a top priority for many organizations, improvement initiatives are often not backed with enough objective tools to drive progress, identify problems and strategize solutions.
Improving DEI starts with understanding the key differences, components, and measurements that make it up.
See, diversity, equity and inclusion are intertwined and systemic in nature. Instances of biases are not one-off anomalies; rather, they’re directly tied to one another:
- Diversity is the presence of “difference” in your organization. It includes having employees from a varied set of ages, races, genders, sexual orientations, beliefs, religions, educations and more.
- Equity involves offering consistent and fair opportunities across all dimensions of employment. When you have a diverse workforce, it’s critical to ensure demographics aren’t treated differently regarding opportunities, compensation or representation.
- Inclusion is about embracing diversity at work. The numerous benefits of a diverse workforce can only be seen if all employee demographics are treated fairly and given the chance to show up as their authentic selves, differences and all.
In other words, a selection process with diverse sourcing and fair hiring of candidates can only do so much. You won’t be able to retain or welcome these employees if your organization isn’t equitable and inclusive as well.
That said, DEI efforts are incredibly hard to measure, especially when hiring at scale, as there are more open roles, recruiters, and applicants involved. That’s where diversity data comes in.
What’s in?
How to approach using diversity & inclusion data
Improving DEI is a complex topic that involves successfully analyzing, planning and implementing change across organizations.
The fabric of DEI, at its core, is employing a diverse set of individuals who all feel they have a voice and a seat at the table. This means that it’s a very human problem, and involves qualitative research as much as it does metrics and KPIs.
With all that being said, you can’t manage what you don’t measure. Data can be a powerful tool to provide insight into the current state of DEI within your organization, highlight the biggest shortcomings, and help gain control over certain areas of your business where bias may be most present.
When hiring at scale, data is a particularly powerful way to identify systemic instances of bias and place control measures to lessen or eliminate them entirely.
There are two primary ways you can utilize data to inform your diversity and inclusion strategy.
Data for diagnosis
Before you can begin to address gaps in the DEI strategy of your company, you need to identify those gaps. Gathering data on diversity, equity, and inclusion within your organization is critical to find your starting point and kickstart your efforts.
In fact, one of the biggest barriers to increasing diversity and inclusion in an organization is the sense that the workforce is sufficiently diverse.
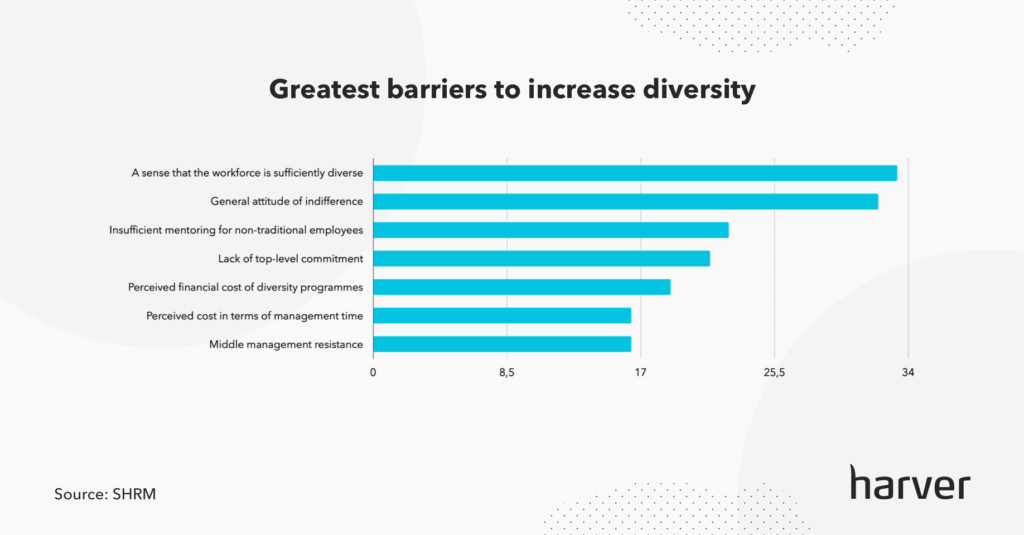
We’ve covered the topic in more detail in our white paper on The State of Diversity Recruiting, which you can download below.
The state of diversity recruiting in 2020
Ongoing data collection
Once you have identified your starting point, you need to have continuous data collection efforts in place for each part of the employee lifecycle, from sourcing, selection and compensation, to engagement, pay, promotion and attrition.
Each of these areas should be tracked and continually monitored for instances of bias or unfair treatment.
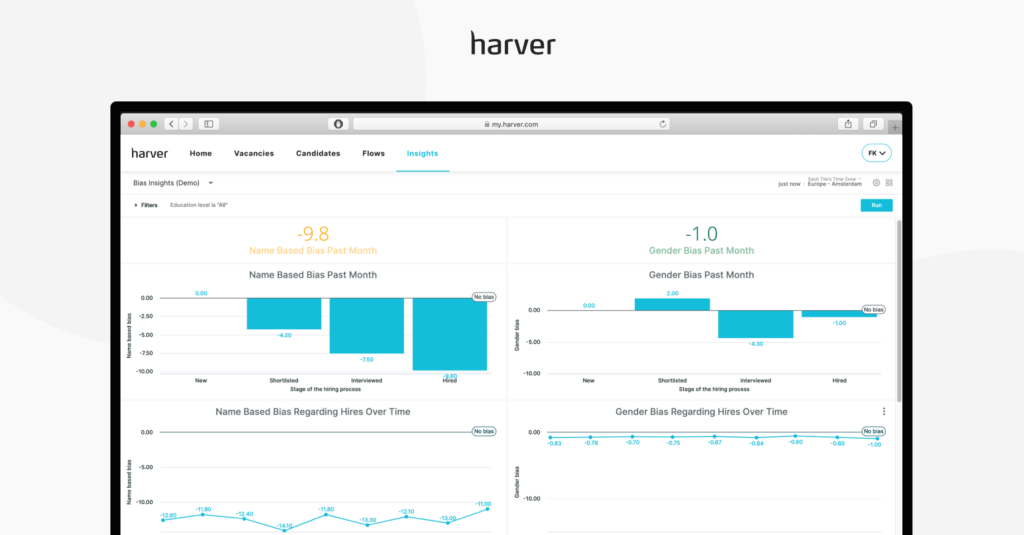
For example, for one of our clients, we’ve developed a D&I measurement framework and implemented a series of pre-employment assessments that enable them to easily see their diversity and inclusion metrics for each of their locations.
This way, they can measure not only the gender and generational diversity but also the bias present in the recruitment process when it comes to a candidate’s migration background or name.
The collected data is easily accessible in the Harver platform on a dedicated D&I dashboard which makes it easy to identify the areas that are more affected by bias.
Below you can see an example of metrics that can be tracked and visualized using our platform.
Taking inventory of DEI in your organization
When looking across the dimensions of diversity, inclusion and equity, you’ll need to take stock of the status quo. At every organization, this looks different, and there are a lot of questions you can ask to find your starting point.
Keep in mind that because of the intertwined nature of diversity, equity and inclusion, key questions and metrics apply to multiple or all dimensions.
8 key metrics can be used as a starting point to make a diagnosis:
- Sourcing – Sourcing metrics compare the number of applicants for open roles from diverse groups to the potential pool of applicants from diverse groups. Sourcing data can be incredibly useful when it comes to identifying barriers to entry for diverse groups and pinpointing biased recruitment efforts.
- Selection – Selection metrics track individuals from diverse groups compared with applicants who are not members of a diverse group. These metrics are useful for identifying bias during the assessment and selection stages of recruitment.
- Representation – Representation data focuses on the percentage of employees from diverse groups compared with company and industry benchmarks. This metric is useful for identifying which groups are underrepresented within your organization.
- Retention – Retention metrics compare the average tenure of diverse employees compared to the average tenure across your entire workforce. This way, you can determine whether certain groups are less satisfied with their position. Additionally, you can use this to identify groups that are most likely to have their employment terminated.
- Promotion – Promotional data tracks promotions awarded to individuals from diverse groups compared with individuals who are not from a diverse group. This is helpful for determining whether certain groups are more or less likely to be promoted at work.
- Development – Development data tracks lateral moves, training opportunities, learning and development participation, and other opportunities by employee group. This helps to identify bias related to employee growth and development.
- Pay and benefits – Compensation data compares financial and non-financial incentives earned by both diverse employee groups and those who are not members of a diverse group. This is useful when it comes to identifying bias related to compensation.
- Employee engagement – Engagement metrics compare satisfaction scores from diverse employee groups to those who are not members of a diverse group. This allows you to identify whether specific groups are more or less engaged at work than others.
Like what you see?
Don’t miss out. Subscribe to our quarterly digest to get the latest TA and TM resources delivered right to your inbox.
How can you use data to improve these metrics?
Once you know where your main challenges lie, you’ll be ready to choose what to tackle and move forward with a plan for DEI improvement.
As with any strategic decision, you have to measure the impact of the changes you make and continue to adjust accordingly in order for those changes to be effective. Otherwise, you are essentially unaware of if you’re making progress when it comes to improving your diversity and inclusion strategy.
Here’s how you can use diversity data to improve on each stage of the recruitment funnel.
Sourcing
When hiring for open roles, your candidates should come from a wide variety of backgrounds.
Where you spot gaps in your sourcing—for example, you may have too few candidates from a particular race or gender—you should seek to attract candidates from a diverse set of backgrounds to your roles.
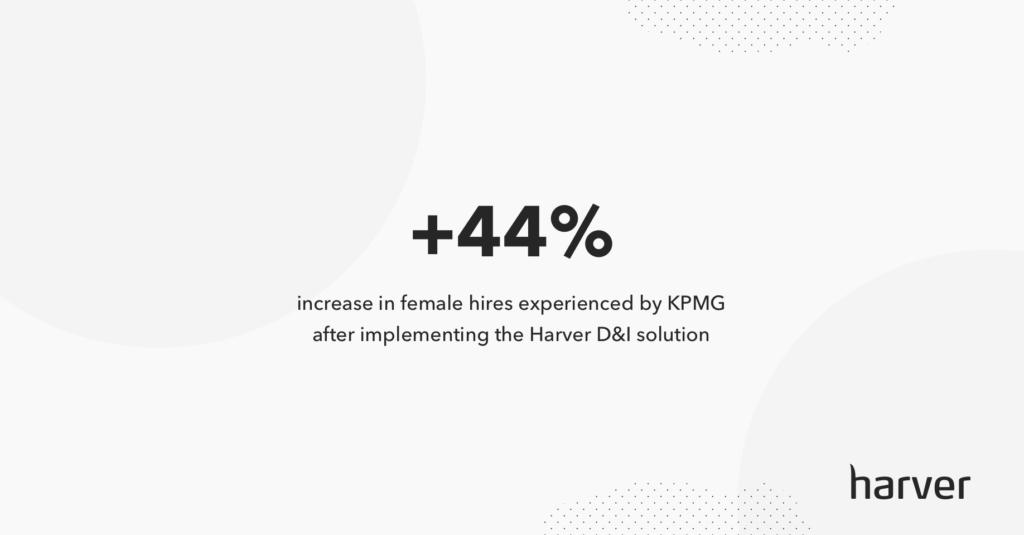
KPMG, one of our clients, operates as a global network of independent member firms offering audit, tax, and advisory services, and has an employee count of over 200,000 globally.
To promote inclusion and diversity among its applicants, KPMG set out to digitally transform its hiring process to ensure they are in line with the company’s values and beliefs.
To achieve their goals, KPMG partnered with Harver to redesign its application process for entry-level hires. The solution we’ve designed for KPMG ensures that all candidates follow a data-driven application process that assesses their hard and soft skills using a combination of personality questionnaires, cognitive ability assessments, and situational judgment tests.
By evaluating candidates’ skills at the onset, KPMG was able to safeguard against unconscious bias during the evaluation process and guarantee each candidate is treated equally— regardless of their background or previous experience.
Selection
When hiring at scale, you should be collecting data on your applicants and comparing the starting pool to who ultimately gets hired. Candidates should be selected based on their applicable skills and qualities, such as with a pre-employment assessment, to minimize interview bias.
Selection criteria, including interview questions, should be standardized, as should their scoring. Candidates’ performance on various selection criteria should always be documented and tracked centrally using your applicant tracking system (ATS).
In addition, you may want to consider anonymizing candidate data during the first phases of selection or using a recruitment bias indicator. By removing indicators of gender, name, age, race, and so on from selection criteria, you essentially remove the potential for unconscious bias in the hiring process.
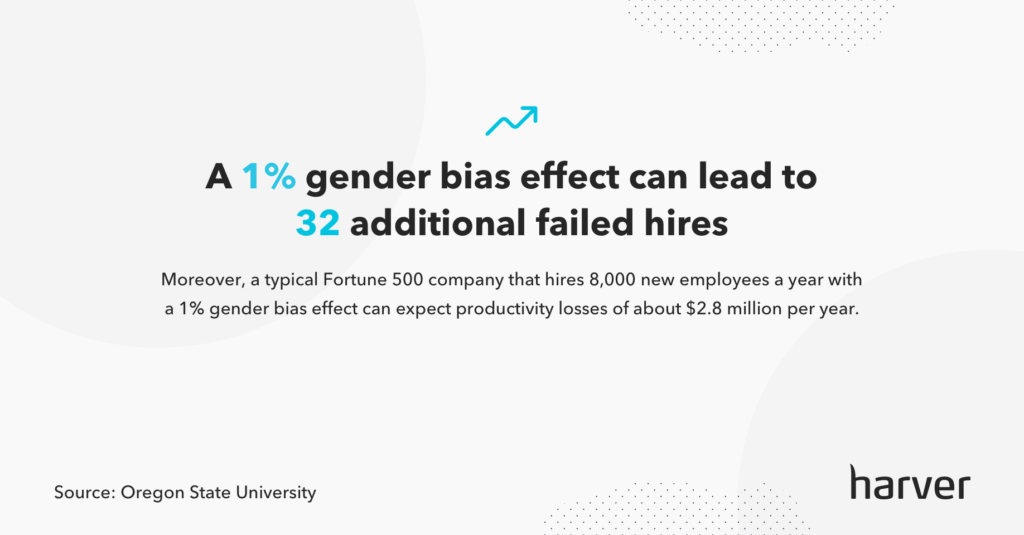
Moreover, with tools like Harver, you can track bias in your process by flagging if candidates from a certain demographic or background are falling out of the recruitment process at higher rates than others.
Representation
Always make it a point to track the demographics of employees on different teams and across various levels of leadership. If you are making an effort to recruit diverse candidates and provide them with abundant opportunities to advance, you should see the data of representation at your organization change and diversify.
This can be accomplished with the aid of a human resources management system (HRMS), many of which have the ability to break down and display different employee demographics. Many organizations now post real-time demographic data publicly to express their ongoing commitment to diversity, equity, and inclusion.
Retention
Pay close attention to demographic attrition. You should be collecting data on employees who leave, and conducting exit interviews if at all possible to determine whether specific groups are leaving at a higher rate than others, and if so, why that’s the case.
Collecting data on your company’s attrition rates with an emphasis on demographic differences can help you identify issues with both equity and inclusion, ultimately supporting your goal of improving your diversity.
Promotion
Similarly to representation, all promotions (or even mobility between teams or roles) should be tracked. Your organization can only be considered truly equitable if all employees are offered fair opportunities to climb the totem pole, so to speak.
If a certain demographic is over- or under-represented when it comes to upward mobility, this should spark instant concern, as it could indicate unconscious bias in this area. Of course, without diversity data, this could be (and likely would be) easily missed.
Development
All employees should have equal access to development opportunities and mentorship. Whereas this dimension of DEI may seem more qualitative than quantitative, it is closely related to how employees will grow and ultimately be promoted or represented in leadership at your organization.
Deploying a digital hub using a learning management system (LMS), or tracking growth opportunities in your company’s HRMS, will help you ensure all your employees have the same opportunities to further develop, grow and refine their skills over time.
Pay and benefits
Compensation is ultimately a number, and benefits have a specific monetary value as well. While compensation and DEI is often a complex, touchy subject, the truth is that it is one of the most clear cut metrics of equity and inclusion.
You should conduct an audit on employee compensation to ensure that commensurate experience is met with equal rewards. Many companies now make smart use of technology to track their employees’ pay and benefits and ultimately ensure equity within this area of employment.
Employee engagement
The most intangible aspect of DEI is the ultimate feeling of belonging. Every employee wants to feel valued and included the same way their colleagues are.
Carefully collecting and analyzing employee feedback—be it positive or negative—is your best way to get your finger on the pulse of inclusion at your organization. On the other side of the coin, employee complaints, instances of bias, harassment, or conflict should all be carefully tracked and monitored.
Although in some instances one strike is more than enough, if a particular employee is racking up complaints, the pattern will only become clear if the data has been collected and analyzed.
A closing thought
In simpler terms, you need to track and analyze metrics to improve DEI at your organization. When managing a large organization, particularly if you are hiring at scale, tracking DEI is an involved and complex process that isn’t always perfectly quantifiable.
However, when talking to each employee of your organization individually is not a possibility, you need the ability to zoom out, gain insights, and take action—just as you would with any other business challenge.
Business intelligence of course applies to DEI the same way it does to talent planning, inventory management, and revenue forecasting. It’s both incredibly beneficial and necessary for achieving success, and the sooner you begin taking advantage of it for your own DEI efforts, the more diverse, equitable, and inclusive your workforce (and organization as a whole) will be.
Want more insight into diversity and inclusion in the workplace and how you can adapt your recruiting efforts to drive meaningful change? Download our free white paper on the state of diversity recruiting for a deep dive on emerging trends and initiatives.
The state of diversity recruiting in 2020

